Open the Ops dashboard
The Ops dashboard is a separate app, Acrity Ops. Open it from the Console system switcher, the app menu labeled Ops. Selecting it takes you from the Console into Acrity Ops with the same workspace already in context.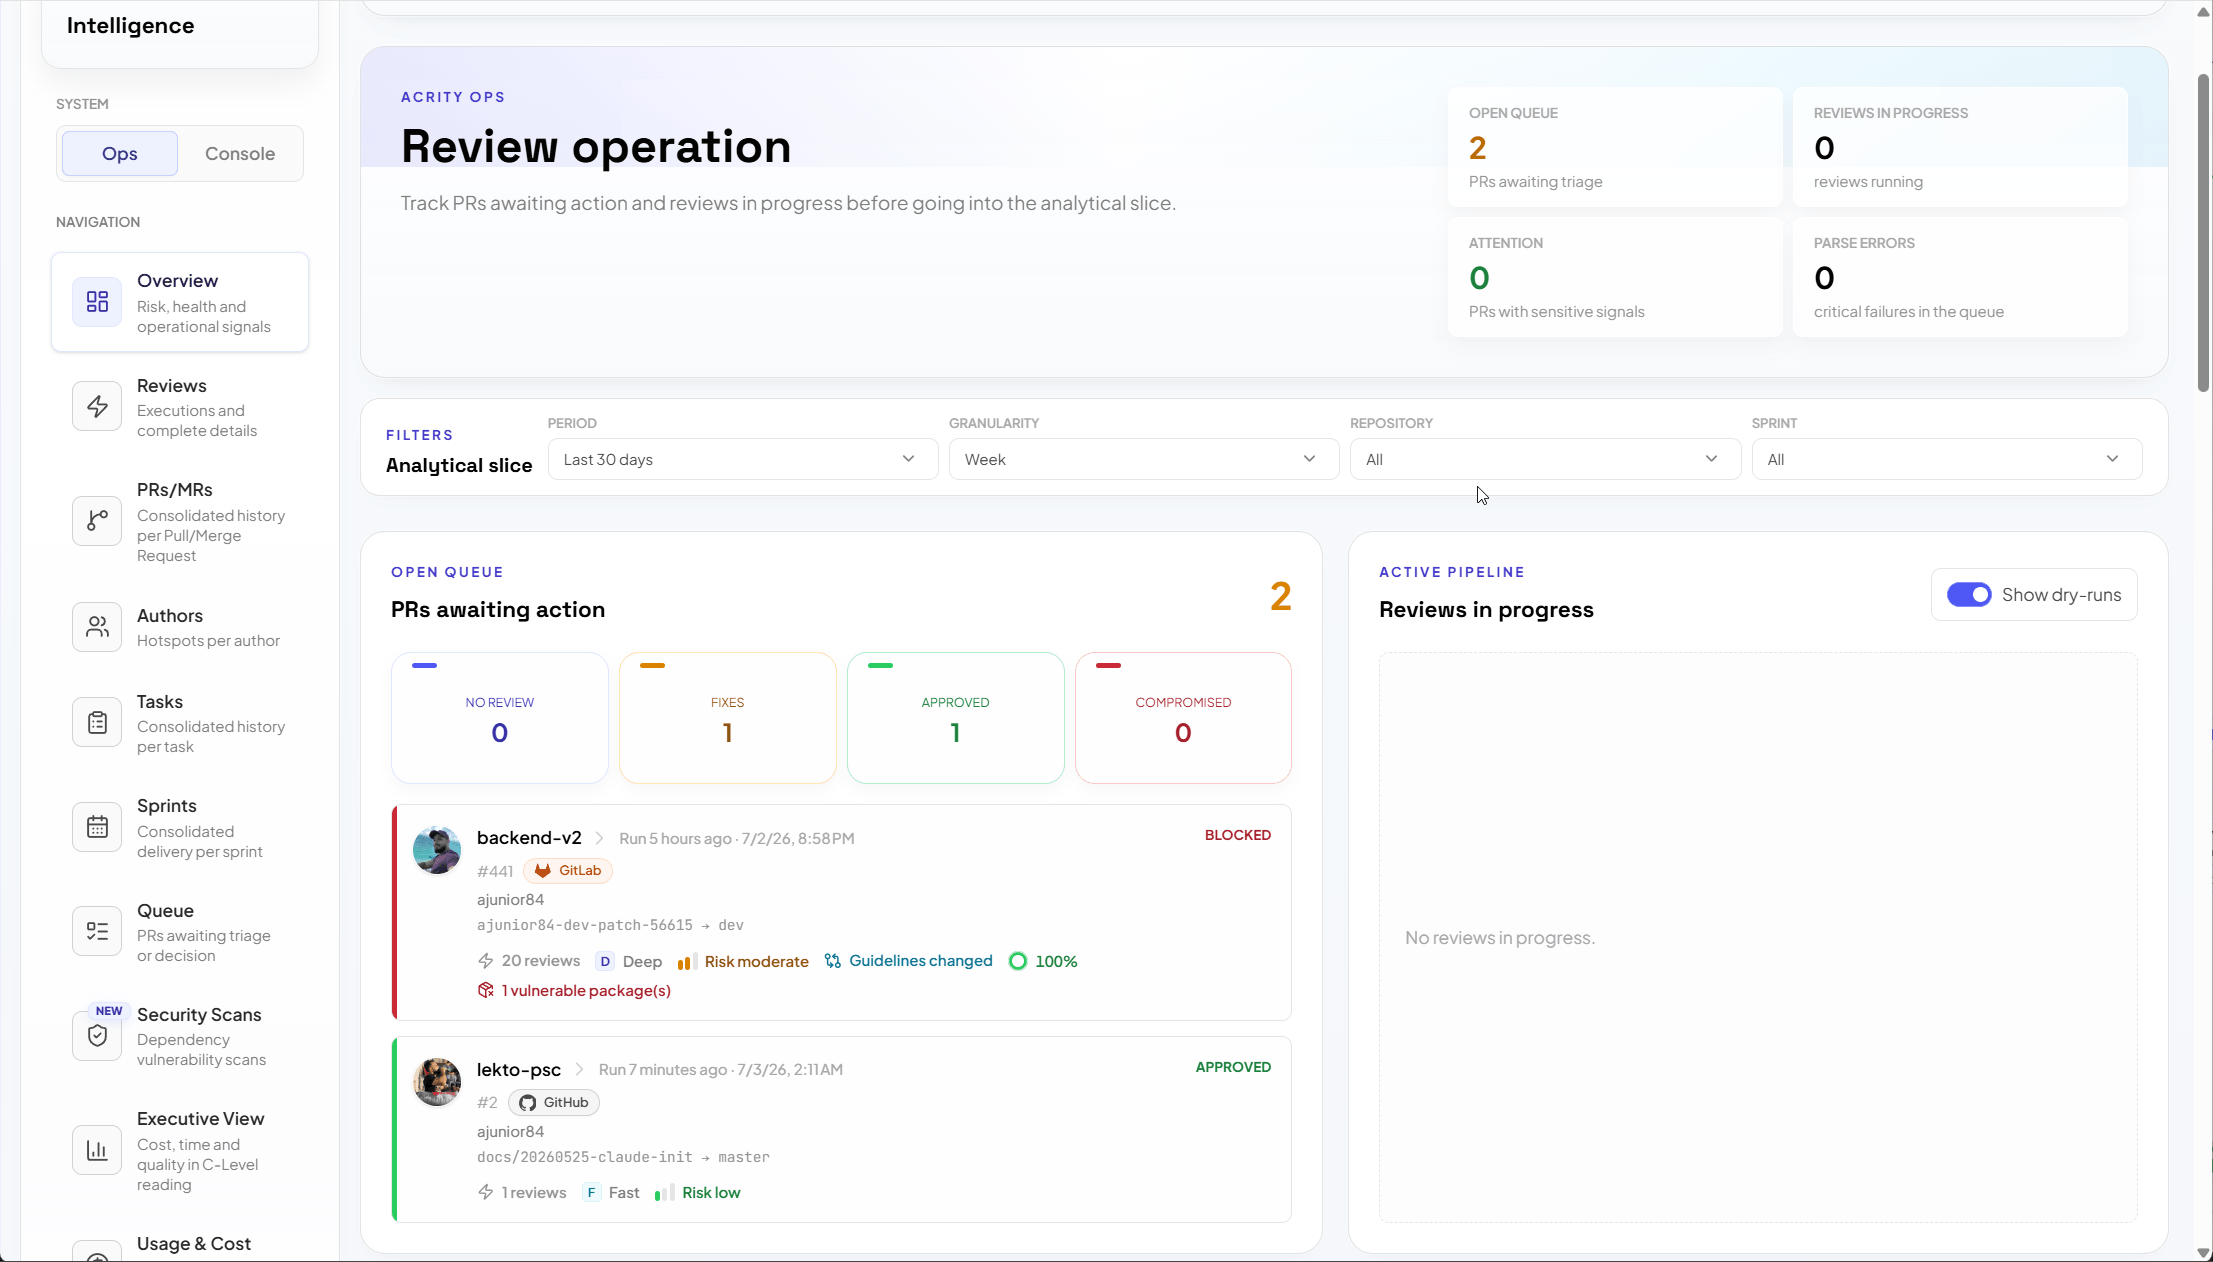
What it shows
The Ops dashboard is the live view of review activity for the selected workspace. In one place you can see:Review status
Whether a review is in progress, finished, or needs attention.
Decisions
The outcome each review reached, so you can act on it.
Findings
The issues a review raised, grouped so you can triage them.
Pull and merge requests
The PR or MR each review is tied to, across your connected providers.
Authors
Who opened the change under review.
Timing and cost
Summaries of how long reviews take and what they consume.
Who can access it
The Ops dashboard is not limited to administrators. Members and above can open and view it, so the people who work with reviews day to day can follow status, decisions, and findings without administrative access.| Role | Ops dashboard access |
|---|---|
| Workspace admin | Can view the Ops dashboard. |
| Maintainer | Can view the Ops dashboard. |
| Member | Can view the Ops dashboard. |
| Billing Manager | Focused on billing; the Ops dashboard is outside this role’s usual scope. |
Ops dashboard vs. Audit Trail
The Ops dashboard and the Audit Trail answer different questions. The Ops dashboard is live review tracking and intelligence: it tells you what reviews decided and what they found. The Audit Trail is the per-run execution log you use for diagnostics: it tells you whether a specific run completed, was skipped, errored, or is still running, and why.| Ops dashboard | Audit Trail | |
|---|---|---|
| Purpose | Live review tracking and intelligence | Per-run execution log for diagnostics |
| Answers | What did the review decide and find? | Did this run finish, and why did it fail or skip? |
| Access | Members and above | Workspace admin (platform admins also have access) |
| Where | Acrity Ops, from the Console system switcher | Console > Audit Trail |
Where this fits
Configure reviews in the Console, then watch them in the Ops dashboard. If you are still setting up, start with the Quickstart, then return here once your first PR or MR triggers a review. To see how a change moves from a connected repository to a tracked result, see Review flow.Quickstart
Connect a repository and trigger your first review.
Review flow
Follow a change from repository to tracked result.
Audit Trail
Diagnose a specific review run.
Console overview
See how the Console areas fit together.